
Rushcliffe's claimant count rose 65 in a month to 1,565 in August, the highest since 2024. Under-25s are 50 of the 90-person annual rise.
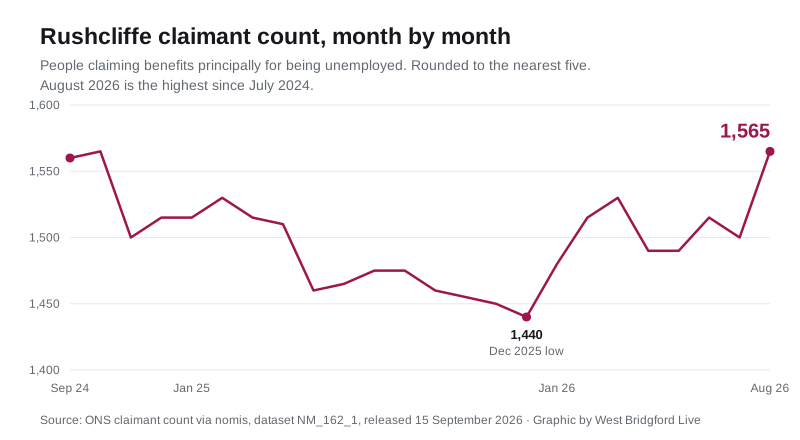
The number of people claiming unemployment-related benefits in Rushcliffe rose to 1,565 in August, up 65 in a single month and 90 in a year.
That is the highest monthly figure the borough has recorded since July 2024. The Office for National Statistics published the August figures on 15 September. (ONS via nomis)
Rushcliffe still has the lowest claimant rate of the seven Nottinghamshire districts, at 2.1% of residents aged 16 to 64. The rate has crept up all year. It sat at 1.9% every month from August 2025 to December 2025, moved to 2.0% in January and has now gone past it.
What the numbers say
- 1,565 people claiming in August 2026
- up 65 on July, the biggest monthly rise since July 2024
- up 90, or 6.1%, on August 2025
- 2.1% of 16 to 64 year olds, against 3.5% across the East Midlands and 3.9% in the UK
- the previous time the count reached 1,565 was October 2024
The rise is mostly young people
Split by age, the annual increase is not spread evenly. Of the 90 extra claimants compared with August 2025:
| Age group | Aug 2025 | Aug 2026 | Change |
|---|---|---|---|
| 16 to 24 | 265 | 315 | up 50 |
| 25 to 49 | 815 | 855 | up 40 |
| 50 and over | 395 | 395 | no change |
Under-25s account for 50 of the 90, so more than half the rise, from the smallest of the three groups. In percentage terms that group is up almost a fifth in a year. The over-50s figure has not moved at all.
By sex, men make up 840 of the total and women 725. Both rose by 45 over the year.
The ONS does not publish a claimant rate for individual age bands, so there is no under-25 unemployment rate to quote here. The counts above are the whole of what the table supports.
How Rushcliffe compares
Rushcliffe’s rate is the lowest of the seven Nottinghamshire districts, and it is a long way below the city across the Trent.
| Area | Claimants | Rate |
|---|---|---|
| Rushcliffe | 1,565 | 2.1% |
| Newark and Sherwood | 2,100 | 2.7% |
| Broxtowe | 2,135 | 3.0% |
| Bassetlaw | 2,360 | 3.1% |
| Gedling | 2,350 | 3.2% |
| Ashfield | 3,035 | 3.8% |
| Mansfield | 2,780 | 4.0% |
| Nottingham | 14,015 | 6.1% |
Rushcliffe has the smallest headcount of the seven districts as well as the lowest rate. Nottingham, which is a separate unitary authority and not part of the county, has nine times as many claimants.
What this figure is, and is not
This is the one part people get wrong, so it is worth being exact. The claimant count is not the unemployment rate. The ONS says so itself: the measure “does not attempt to measure unemployment, which is a concept defined by the International Labour Organisation (ILO) as all those who are out of work, actively seeking work and available to start work”.
What it does measure is “the number of people claiming benefits principally for the reason of being unemployed”. Since Universal Credit, that includes people who are working but on low earnings and still required to look for more hours. A rise can therefore reflect a change in who has to claim, not only a change in who has a job.
Two more caveats:
- the series was reclassified from National Statistic status to Experimental Official Statistics, because Universal Credit changed its coverage over time
- figures are rounded to the nearest five for publication, so a monthly change of five is within the rounding
What it means for you
The figure is a borough total. It covers West Bridgford, Bingham, Cotgrave, Ruddington, Keyworth, Radcliffe on Trent and East Leake together, and nothing in this release breaks it down by town or ward.
- If you are claiming, Rushcliffe Borough Council runs the local support routes, and its benefits pages cover council tax support and discretionary housing payments, which are separate from the jobcentre claim counted here.
- If you are under 25 and looking for work, you are in the group the figures say is growing fastest locally.
- The next release is 20 October 2026, covering September.
The other borough-wide number worth reading alongside this one is the housing market. The Rushcliffe average price fell 1.5% over the year to July, the weakest annual change in Nottinghamshire, which we covered in our July house price report. Our West Bridgford house prices page works at postcode level.
Sources
- ONS claimant count for Rushcliffe, via nomis, dataset NM_162_1, released 15 September 2026
- ONS, Claimant Count Quality and Methodology Information
Have your say